This web page was produced as an assignment for Genetics 564, an undergraduate course at UW-Madison.
What is genetic expression analysis?
Gene expression analysis is used to understand what genes are being transcribed in the presence of specific stimuli. This could be in response to specific drugs, physical stimulus, or gene theory. Gene expression data is used to understanding protein function. Using BioGPS, I found a chart of the expression levels of COL5A1 in different cell types. Then using GEO, I found a Gene Profile of COL5A1 for when a person is exercising.
Expression levels of COL5A1
Below is bar graph showing the expression levels of the COL5A1 in different cell types (1).
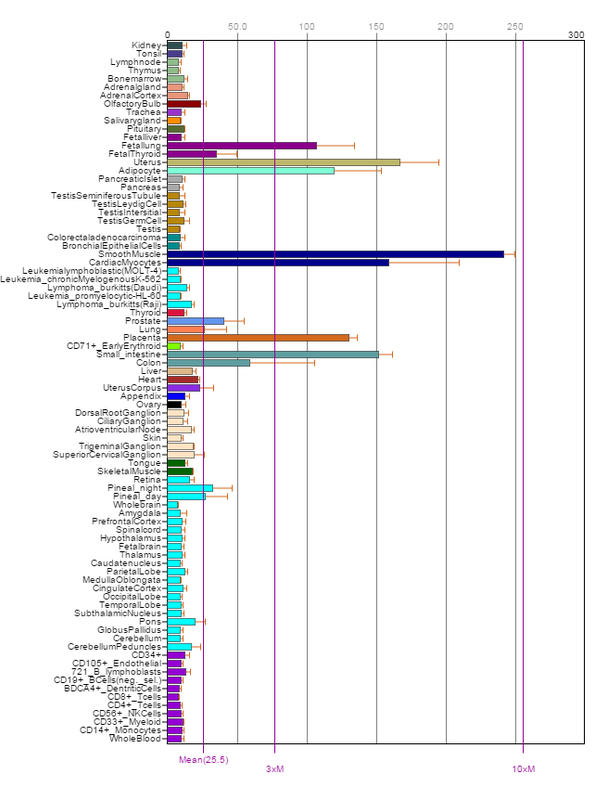
The expression is fairly ubiquitous in most cell tissues. From the chart we can see there is an increased level of expression in smooth muscle cells, indicated by the large dark blue line. This is to be expected given the known function of COL5A1 and type V collagen.
Gene Profile of COL5A1
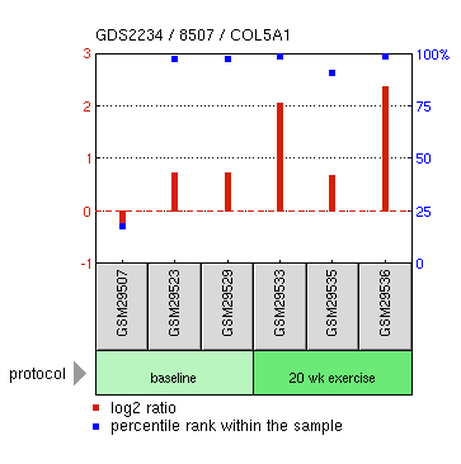
This genetic profile came from an experiment testing skeletal muscle response to endurance exercise training (2). We see from the profile that COL5A1 transcription increases with exercise duration. The main focus of the overall project is on muscle ligaments and endurance training, but there didn't seem to be any available sources with that focus.
Reference
1. http://biogps.org/#goto=genereport&id=1289
2. http://www.ncbi.nlm.nih.gov/geo/tools/profileGraph.cgi?ID=GDS2234:8507
2. http://www.ncbi.nlm.nih.gov/geo/tools/profileGraph.cgi?ID=GDS2234:8507
Website Author: Logan Silber
Contact email: [email protected]
Page last updated: 5/15/2015
Course Homepage: www.genetics564.weebly.com
Contact email: [email protected]
Page last updated: 5/15/2015
Course Homepage: www.genetics564.weebly.com
